Analytics
Analytics brings reach, impressions, engagement, and follower growth from every connected account into one dashboard — over any date range, filtered by platform. Sort your best posts, find the slots your audience actually engages, and turn the numbers into the next thing you publish.
View demo
Works with 12+ platforms your audience already uses
WHY ANALYTICS
Native insights live in twelve different apps, each with its own numbers and its own idea of a "view". Analytics puts every metric in one place, on one timeline, so a good week is something you can explain — and repeat.
INSIDE ANALYTICS
Overview
Your key metrics in one view — reach, impressions, engagement rate, and follower growth across every connected account.
Growth over time
Chart followers, reach, impressions, or engagement across any date range, and see the line bend before you feel it in your results.
Platform comparison
Put your platforms side by side and see which one is actually earning its place in your week.
Top-performing posts
Sort every published post by what it earned, so "what worked" becomes a ranked list instead of a hunch.
Best time to post
See which days and hours your audience actually engages, and let Qootra fill the strongest slot when you schedule.
Reports & export
Build a report for a week, a campaign, or a client, and export it — so the numbers leave the dashboard when you need them to.
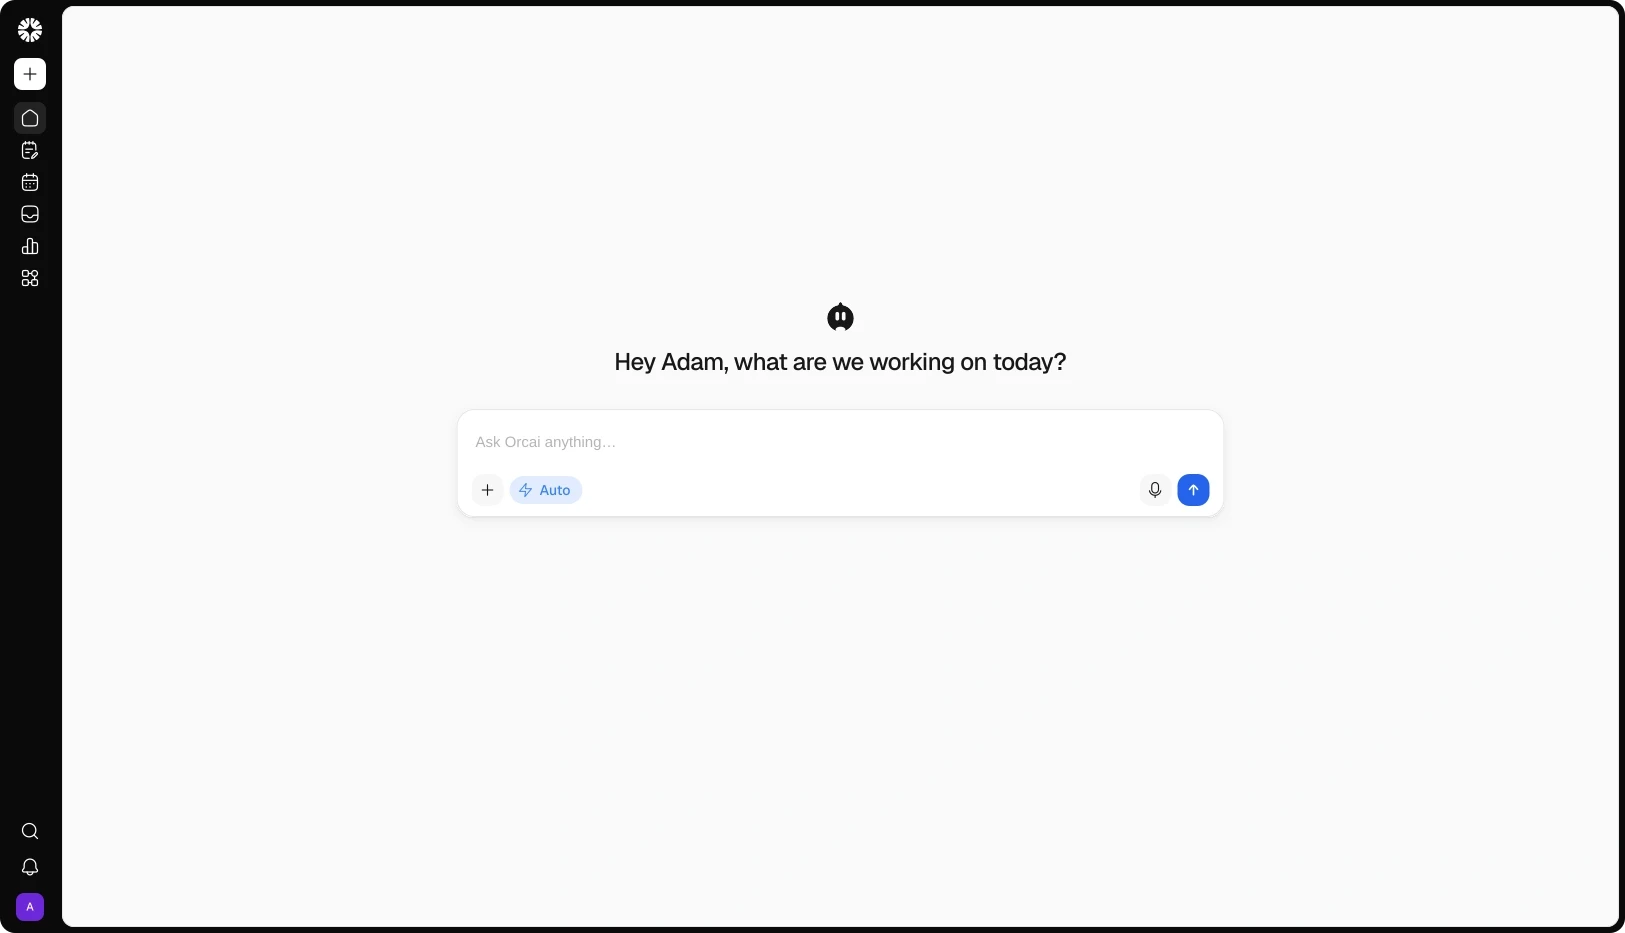
ORCAI IN ANALYTICS
OUTCOMES
10x
Faster reporting
One dashboard pulls reach, impressions, engagement, and follower growth for every account over any range — no spreadsheets, no manual exports.
25x
Better content decisions
Sort every published post by what it actually earned, and see which platform, format, and hook earned it — so the next post starts from evidence.
89%
Less manual reporting
Reports build from the same data and export in one click, so the weekly update stops being an afternoon of copy-paste.
FAQs
Which platforms does Analytics cover?
All 12 connected platforms. Where a platform doesn't expose a metric — TikTok post-level stats, for example — Qootra says so instead of showing you a zero.
How far back can I look?
It scales with your plan: 30 days on the entry plan, then 90 days, 12 months, and up to 24 months on the top plan.
Can I export the numbers?
Yes. CSV on paid plans and PDF on higher plans, and Analytics can generate a report for a date range and keep it in your list when it's ready.
Where does the data come from?
Straight from each platform's API through your connected accounts. Qootra reports what the platform reports — it doesn't estimate or fill gaps with guesses.
What is "best time to post"?
Qootra reads when your audience actually engages and shows your strongest days and hours. It needs at least 14 days of history before it can recommend a slot.
Does Orcai make up numbers?
No. Orcai only reads your real workspace data, and a check blocks any figure that isn't in it. If the data isn't there, it says so.
Do I get audience demographics?
On higher plans, where the platform provides them — age, gender, and location for your connected accounts.
Is Analytics a separate tool?
No — it's part of Qootra, in the same workspace as the Planner, Content Studio, Smart Inbox, and Automations. What you learn here feeds what you plan next.
Does Analytics show competitors?
Not here — Analytics reports on your own connected accounts. Competitor research lives in the Planner, beside the plan it informs.
